Kibana - First steps
Firt things first: who is who ?
Kibana is a visualisation tool tighly integrated to Elasticsearch. As we can read on the Official Kibana website, its purpose is to provide digested data for business interpretations:
Kibana is a free and open user interface that lets you visualize your Elasticsearch data and navigate the Elastic Stack. Do anything from tracking query load to understanding the way requests flow through your apps.
And since Fast2 stores every single byte of migration information into this particular database, using Kibana for intelligible and functional reports just comes in naturally.
![]()
Tracking, follow-up, reports
All the chart visualizations which can be built up with Kibana and intergrated to the most advanced dashboards, serve solely one purpose: data digestion for tracking progress, making now possible to follow edge-cases of a handful of documents lost in a week-long non-stopping flood, and build reports out of it.
Kibana with Fast2
Now that things are getting clearer on the underlying motive of relying on Kibana, let’s dive right into the technical aspect regarding the combination of Fast2 and this third-party software.
Start-up sequence
When Fast2 is started, either as a standalone application or a service, its different modules share a precisely defined roll-out schedule:
- First, the broker and Elasticsearch are started. The connection between these 2 components has to be effective, otherwise Fast2 will automatically shut down after a couple of attempts to reach the database;
- The worker is then triggered, and has to register itself to the broker.
- Finally, Kibana will be started if asked so, and if the binaries have been detected. This is the moment where Fast2 will try to reach a separate instance of Kibana if one is already running on the machine.
There is no direct connection between the broker and Kibana. The only exchange area is the Elasticsearch database, as explained in the Architecture section.
Add-on vs official release
There are two ways to work with Kibana during a Fast2 migration:
- Getting the Kibana add-on available with Fast2
- Downloading online the compatible binaries of Kibana
In case you opt for the second option, a few adjustments need to be made in order to get the proper integration of Kibana to Fast2 (adjustments already tackled by the add-on).
- The Kibana binaries has to be the OSS (Open-Source Software) proposed by Elasticsearch, as ‘Past Releases’ assets;
- The version of Kibana must be compatible with the Elasticsearch module embedded in Fast2;
- Ports have to be updated in accordance with Fast2, both in Fast2 and Kibana configurations.
Kibana ports
By defaulf, Fast2 will expect Kibana on the port 1791. Changing this port will need to happen in 3 places :
| File | Specification | Purpose |
|---|---|---|
| /config/application.properties | broker.kibana.embedded.port=<kibana-port> |
This is required to start the add-on on another port. |
| /kibana-X.X.X/config/kibana.yml | server.port: <kibana-port> |
Fast2 should know where to send the user for the visualizations. |
| /kibana-X.X.X/config/kibana.yml | elasticsearch.hosts: <es-server:es-port> |
The Elasticsearch port (which Fast2 changes by default) to read the data reported in the charts. |
Access to Kibana
Kibana visualizations can be reached via 2 different ways, depending on your needs:
- Either the main panel from the UI of a running Fast2,
- Or directly from the browser via the declared port (1791 or other).
The latter option gives access to the tool even when Fast2 is not running.
Although since Kibana fetches data directly from Elasticsearch, it is not possible to populate the visualizations with migration data if the database is not running as well.
How to disable Kibana
Kibana is definitely an add-on on top of Fast2, which means that starting Fast2 without Kibana will not get you into any trouble – by the bye, Fast2 is shipped without Kibana by default.
If a port has been configured for Kibana, Fast2 will ping this port to check if a running Kibana instance is already available. If not, our tool will scan the installation folder (where the broker and worker scripts are located) searching for any Kibana directory.
The configuration property responsible for such behavior can be found in the config/application.properties file:
broker.kibana.embedded.enabled=true
If no Kibana start file is found, Fast2 will stop attempting to start Kibana after 200 retries (this value can be edited in the config/application.properties file under the name broker.kibana.embedded.maxRetries), but will still be usable.
Kibana assets
All new visualizations should be based on the f2_* index. For further analysis requiring narrower filters, the KQL query can be edited so the only results will match your scope of study.
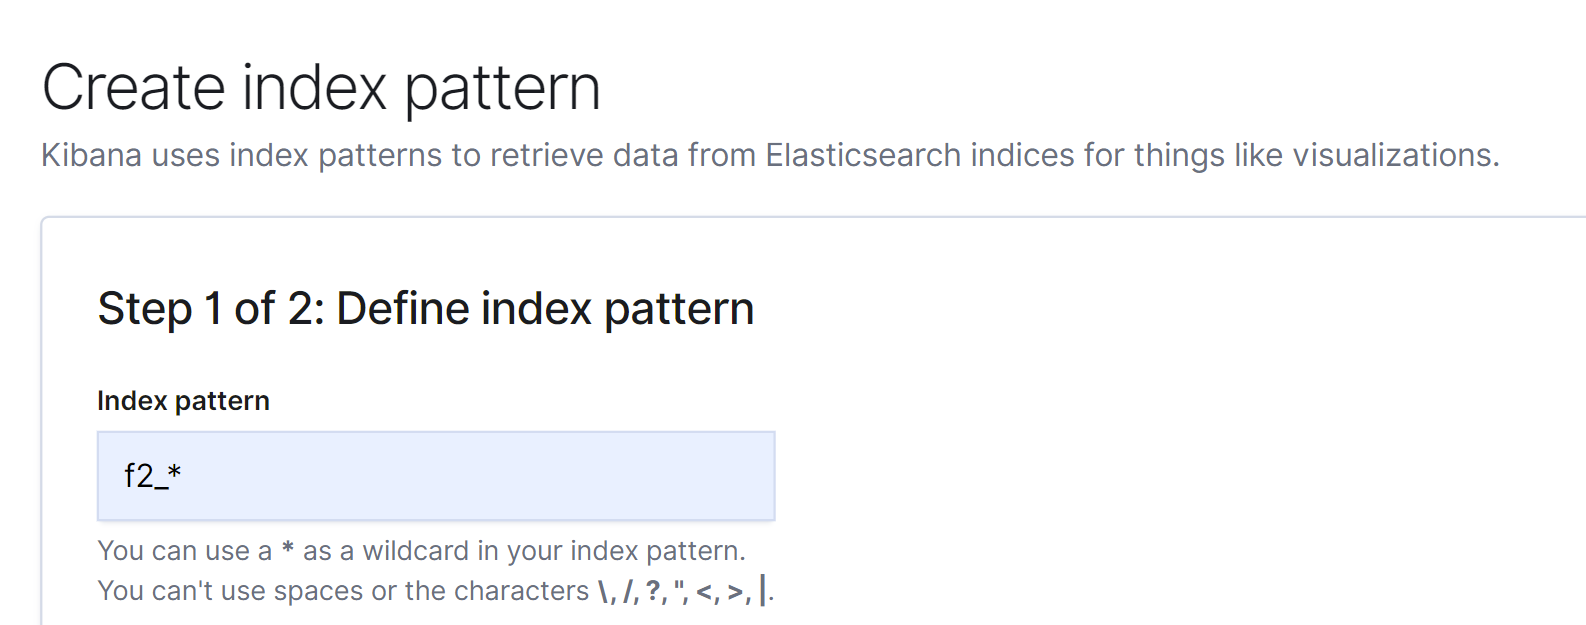
To create an index pattern, head to Kibana then Management > Index Patterns and hit “Create index pattern”.
Enter the index pattern related to Fast2 data:
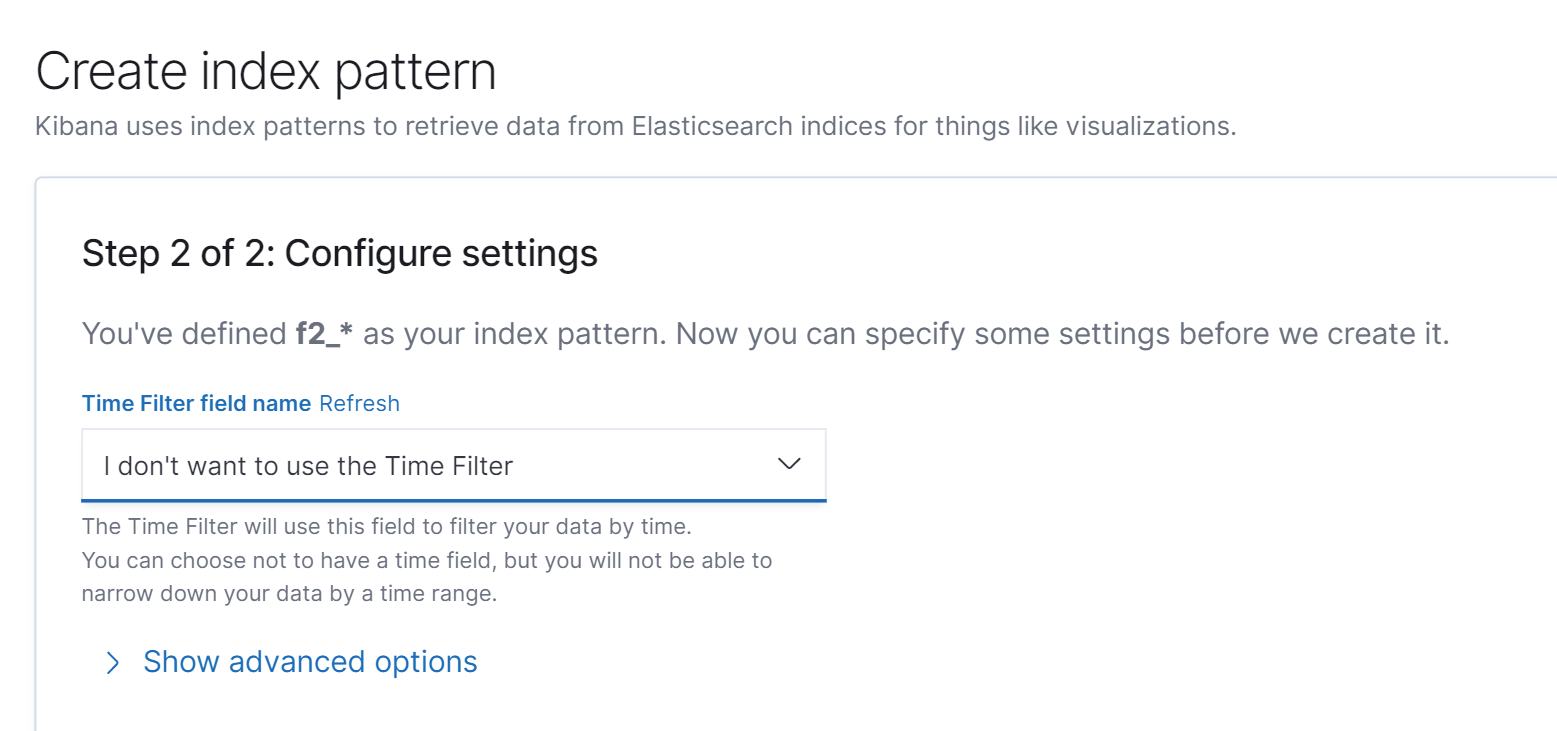
No time filter is required, select the right option and hit “Create index pattern”.
You can now build your own visualizations, or checkout the Official documentation of Kibana to get started.
Common error messages
| ⚠️ Message | 💭 Reason | ✔️ How to fix |
|---|---|---|
| Kibana could not ping Elasticsearch | The most current reason for such issue is the misconnection of Kibana to Elasticsearch. | Make sure the database port has been correctly configured in the kibana.yml file. Head to the port section for more details. |
| Could not ping Kibana on port 1791 | Chances are your Kibana has started on its default port – 5601, not to name it. | This can be fixed by updating the Kibana port in the kibana-X.X.X/config/kibana.yml file with a new line server.port: 1791. |